WiseNest is built for anyone who takes retirement seriously.
The Math, done right —
for real families.
WiseNest runs a full actuarial-grade financial engine — built for the complexity real families actually face: multi-generational households, dependent children, coordinated Social Security, and the honest math of healthcare inflation.

Most retirement calculators give you a number. WiseNest gives you a strategy.
Three fundamental differences that separate WiseNest from every other retirement calculator — not just features, but a completely different philosophy of what a retirement plan should do.
Real-Life Variables
Dependent child SS benefits, healthcare inflation phases, SSA solvency scenarios, and long-term care costs — variables that exist in every real family's retirement but in zero classic calculators.
Coordinated Family Math
Survivor benefits, spousal Social Security coordination, multi-generational legacy goals, and Familia plan permissions — because retirement is never just one person's decision.
Live Feedback Loop
Pay off a debt and watch your Monte Carlo success rate climb. Sync a real account and your projections update instantly. Every input connects to every output in real time.
One engine.
Two views.
The single line you trust isn't an opinion — it's the median of 10,000 simulated paths of your money. Half of those futures end above it, half below. The calm band around it is the range from rough markets (p10) to strong markets (p90). Same model, one number.
Those 10,000 paths aren't built from one blended guess. Each asset class gets its own expected return, its own volatility, and its own fat tails — and the engine models how those classes move together. A mostly-stock plan shows a wide band; a cash-heavy plan shows a tight one. The band reflects your real mix, not a generic average.
And it's not just what returns you get — it's when. A rough market in your first year of retirement hurts far more than the same one at year 20. The engine models that order, the way real life delivers it, so the number you see has already lived through the bad-luck years.
How it works
What the line really is
The line people trust is the median of 10,000 paths — not a best case, not a guess. The shaded band around it is simply rough markets vs. strong markets, drawn from the very same model.
THE CALCULATION MOST PLANS MISS
The Survivor Cliff
When one partner passes, household income typically drops 30–40%. But the bills don't drop 30–40%. Social Security rules change. Tax filing status changes. Medicare costs may rise. And the survivor often faces this financial restructuring at the worst possible emotional moment.
WiseNest models all of it. 10,000 Monte Carlo simulations run every survivor transition, including income recalculation, Social Security survivor benefit timing, and the exact insurance gap needed to close the shortfall.
This isn't theoretical. It's the most important number in your retirement plan — and it's the one most advisors skip.
30–40%
typical income drop at survivor event
10,000
simulations model every transition

Math that reflects your real life
Not just generic projections
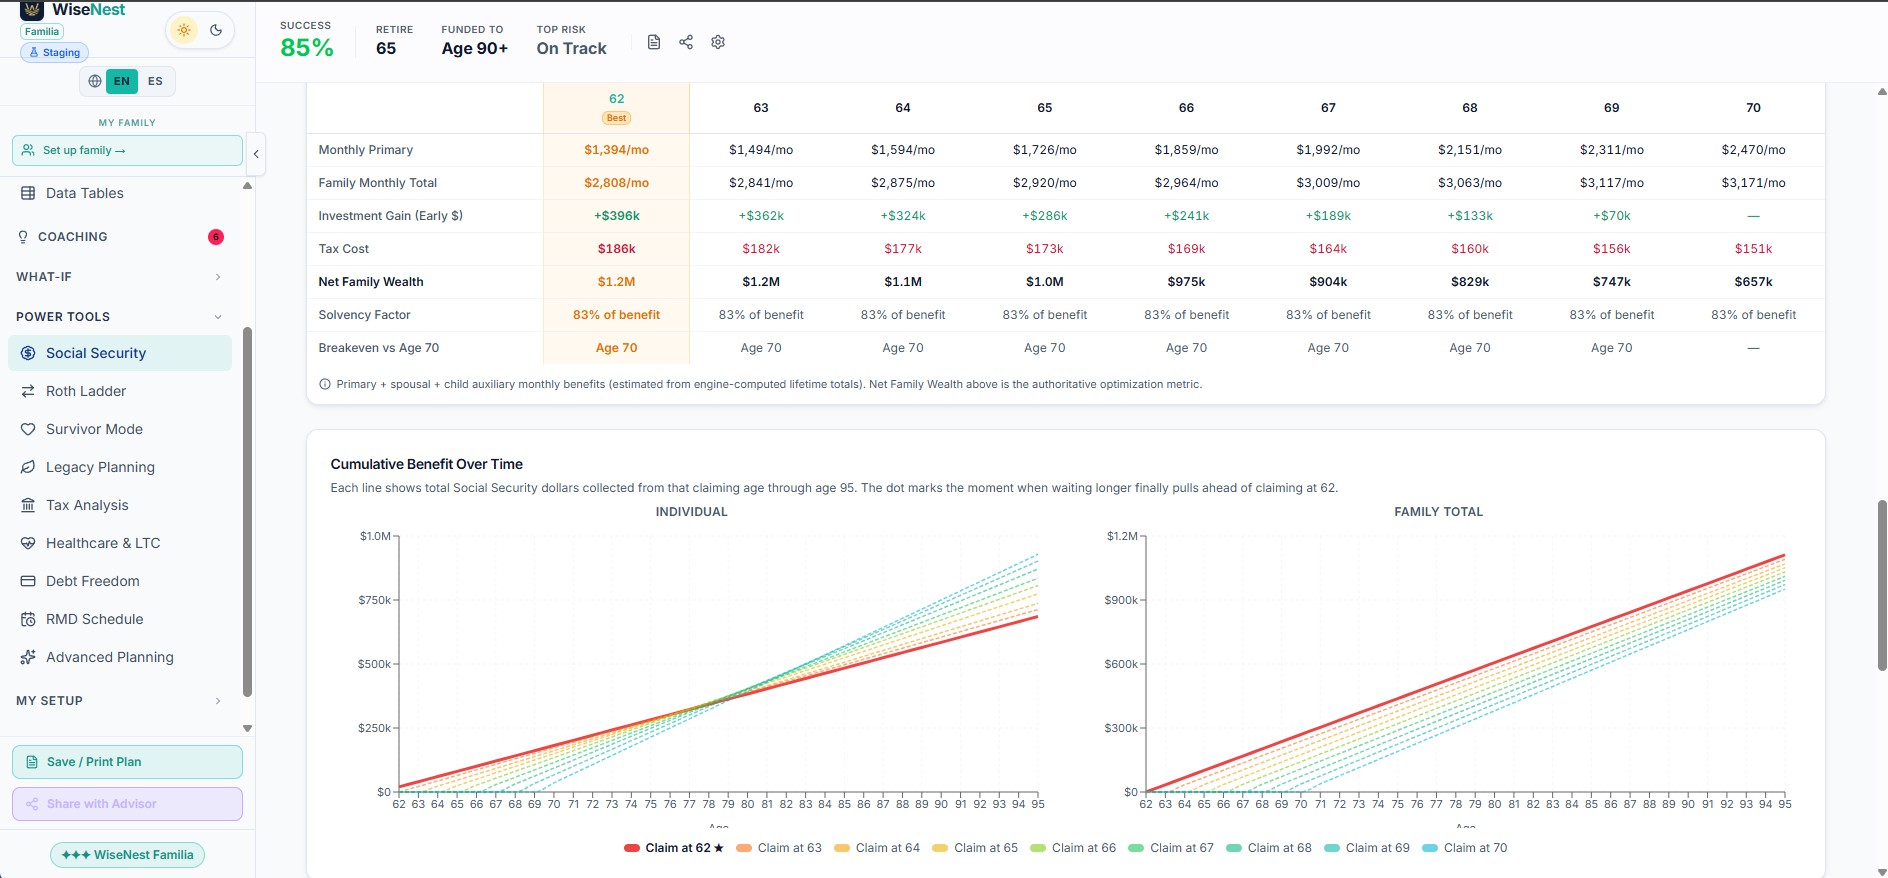
Social Security: The Biggest Financial Decision Most Families Get Wrong
When one spouse dies, the household keeps only the larger Social Security check — for the rest of the survivor's life. So the real question isn't "which age pays the most?" It's "which strategy protects whoever is left?" WiseNest optimizes for that — while still modeling dependent-children benefits, the returns on early checks, and three honest scenarios for Social Security after 2033.
The survivor income cliff
When one spouse dies, the household keeps only the larger benefit — forever.
Social Security has no joint-and-survivor split. When one spouse passes, the survivor keeps the larger of the two monthly benefits and permanently loses the smaller one. The household doesn't keep both, and the loss never reverses.
A real example
Both alive — combined
$3,000/mo
Survivor keeps only
$1,900/mo
A couple receiving $1,900 + $1,100 = $3,000 a month drops to $1,900 the month one of them passes. That's a 37% cut to Social Security income — and the survivor can live with it for fifteen, twenty, even thirty years, while household expenses barely fall. One person doesn't cost half of two: the rent, the property tax, the car, the Medicare premiums are nearly the same for one as for two.
Maximizing total lifetime Social Security dollars — the number most calculators optimize — can be the wrong goal. It quietly assumes both spouses live to about 85. But if one dramatically outlives the other, the survivor faces years on a single, reduced benefit AND a portfolio that must now draw harder to cover the gap — and a bear market early in that stretch is exactly when a household can least afford it.
WiseNest models this directly. We weight the survivor-longevity tail and the increased drawdown and sequence-of-returns risk the survivor carries alone — not just the expected-case combined dollars. The app surfaces it with dedicated cards in-product; this is the why behind them.
Not a slogan — modeled. The Real-Life SS Optimizer scores every claiming pair on the survivor's lifelong floor, not just the combined lifetime-dollars total a classic calculator chases.
That's why the engine so often recommends the higher earner delay to 70: their larger benefit becomes the survivor's lifelong floor — even when delaying doesn't maximize the naive lifetime-dollars number.

Social Security timing can make or break your retirement
WiseNest finds your exact best moment
Four breakthroughs classic tools miss
Dependent Children Benefits
If you have young children or a special-needs child, claiming early unlocks auxiliary benefits — up to 50% of your PIA per eligible child, every month, from day one. A family with twins can collect an extra $1,200–$2,000/month while the parent claims at 62. Classic break-even math ignores this entirely. We don't.
Investment Growth on Early SS Income
What if you reinvest those early Social Security checks into a HYSA or a balanced portfolio instead of spending them? The math changes dramatically — shifting the break-even point by 3–5 years. Sometimes claiming at 62 is the smarter choice, even for healthy couples.
Transparent Solvency Scenarios
The Social Security trust fund faces projected shortfalls after 2033. We don't hide this. You get three honest scenarios — Optimistic (full benefits), Base (gradual reductions from 2033), and Pessimistic (steeper cuts) — so your plan holds up whatever Congress decides.
Coordinated Spouse & Survivor Strategy
Which spouse claims first? Delaying the higher earner protects the survivor — but by how much? WiseNest models both spouses simultaneously, finding the coordinated claiming ages that maximize lifetime household wealth while safeguarding the lower-earning spouse for decades. It's not two separate decisions. It's one coordinated family strategy.
A family claiming at 62 with two young children could receive $1,400–$2,000/month in auxiliary benefits — invisible to every classic calculator.
Honest assumptions
- SSA solvency projections are estimates from the SSA Trustees Report — not guaranteed outcomes. Laws can change.
- Investment return rates are configurable assumptions — not promises. Past performance doesn't guarantee future results.
- Results are planning estimates based on your inputs. WiseNest is not a registered investment advisor. Talk to a fiduciary advisor before making major decisions.
"I'm an engineer. I've tried every retirement calculator out there. WiseNest is the only one where I can read every formula, change every assumption, and actually trust the output. The Monte Carlo implementation is legitimately excellent."
Priya S.
Software architect, age 52 · 10,000-simulation Monte Carlo user
"What sold me was the 'Honest Limitations' section. Any tool that tells you what it can't do earns instant trust. The math is complex but the explanations are crystal clear."
Dr. Alan F.
Retired physician, age 67 · Self-directed retirement planner
The IRS has brackets. We know all of them.
Your retirement tax bill isn't just "federal income tax." It's brackets, Social Security taxability thresholds, Medicare surcharges, RMD-driven income spikes, and — if you're generous — QCDs that make part of your RMD disappear entirely. We model all of it.
Federal Brackets — 2025 IRS Numbers
2025 IRS brackets for Married Filing Jointly, Single, and Head of Household. Not estimates — the real numbers from 26 U.S.C. §1, updated annually for inflation.
All 50 States — Real Bracket Data
Every state's actual retirement income rules: SS exemptions (Illinois, Pennsylvania, Mississippi fully exempt SS), pension exemptions, state-specific brackets.
Thinking about retiring in Florida vs California? The relocation analyzer shows exactly what that move saves you over a 25-year retirement.
Medicare IRMAA Surcharges
Medicare isn't free — and your income determines how much extra you pay. We model all six IRMAA tiers (Part B + D) and project when you cross each one.
QCDs — Tax-Free Charitable Giving from Your IRA
Qualified Charitable Distributions let you donate up to $111,000/year directly from your IRA — it counts toward your RMD but never hits your taxable income.
Enter your annual QCD amount and we subtract it from your taxable RMD, show the federal tax savings, and compare it to a regular charitable deduction.
Roth Conversion Ladder
The years between retirement and age 73 (when RMDs kick in) are your golden window: income is low, brackets are empty, and you can convert Traditional IRA funds to Roth at a bargain rate.
Conservative (fills 10% bracket), Moderate (22%), Aggressive (24%) — or set your own. We show projected lifetime tax savings for each strategy.
RMD Engine — IRS Uniform Lifetime Table
Required Minimum Distributions start at age 73. The amounts grow every year as your distribution period shortens. We use the actual IRS Uniform Lifetime Table — not a simplified approximation.
Peak-RMD detection shows the year your withdrawals spike highest, so you can plan conversions to smooth the tax curve.
What happens if only one of you
makes it to retirement?
Nobody wants to think about it. But a plan that only works when both spouses are alive is only half a plan. Survivor Mode runs the full projection two ways — and then tells you exactly how much life insurance closes the gap.
What the engine models
Life Insurance Gap Calculator
If the surviving spouse's success rate falls below 80%, we calculate the exact life insurance coverage needed to close the gap — automatically.
// How WiseNest computes it
insurance_need = PV(monthly_gap,
years, real_return = 6%)
// Present value of your survivor's monthly
// income gap — discounted at 6% real return.
Output: "Your plan needs approximately $X in term life coverage to keep your spouse's success rate above 90%."
How we treat home equity — and why we neither hide it nor quietly prop your plan up with it
For most American families near retirement, the house is the biggest piece of the picture. We don't bury it, and we don't quietly prop your plan up with it. Here's exactly how the math works.
How we model your housing cost
A fixed loan payment never rises — so we don't pretend it does
We hold your fixed mortgage payment level — a fixed-rate loan never rises — and drop it the year it's paid off. Property tax, insurance, HOA, and rent we grow with inflation. If you downsize, we count the cash after the remaining mortgage is paid.
Medicare isn't free.
Here's exactly what it costs.
Healthcare inflates at 5–7% per year — roughly twice the general inflation rate. Ignore it, and your projections look great on paper right up until they don't. We model three distinct phases that most tools miss entirely:
Phase 1: Medicare Base
Part B + D premiums starting at 65, based on the current Medicare Part B base premium, compounding at your healthcare inflation rate.
Phase 2: IRMAA Surcharges (income-related Medicare adjustment)
Income-tested surcharges layered on top. Six tiers. We project when your income crosses each one — and flag when a Roth conversion at 63 affects your Medicare at 65 (the 2-year look-back rule).
Phase 3: Long-Term Care
You choose when LTC costs begin — not us. Industry average is 75, but you might have family history that says 68 or 85. A dedicated slider, no hidden assumptions.
What you control
The number most tools miss
A couple retiring at 65 will spend an average of $315,000 on healthcare over a 20-year retirement — not counting long-term care. Add LTC and that number can easily double. WiseNest shows you this on a year-by-year chart so it's never a surprise.
Your real balances.
Your real plan.
Connect your checking, savings, 401(k), IRAs, and brokerages. Every balance update flows directly into your projections — no manual entry, no guessing, no "I think my 401k is around..."
Not ready to connect? Manual entry and CSV upload are always available. Your privacy is the default, not an upsell.
Bank-grade security
mTLS connections — same encryption standard as your bank's own infrastructure
Up to 4 refreshes / month on Pro
Pro and Advisor tiers. More than enough to keep your plan current.
Manual fallback
Always available. CSV upload imports balances from any export.
We never sell data
Your financial data stays yours. We don't sell it, share it, or monetize it.
One household, one ledger — every dollar counted once.
Your family's money lives in one place: each dollar has a single owner, the things you share are shared on purpose, and nothing gets counted twice. 'My plan' shows what's yours; 'Our household' shows how it all fits together.
Boldin · ProjectionLab vs. WiseNest
Other planners model one person at a time. WiseNest models your whole household as a single ledger — no double-counting, no one left out.
WiseNest builds your household readiness from each person's own plan and the accounts you authored — every dollar counted once — and shows the shared money you record in your family's totals view.
Every tool has limits. Here are ours.
We'd rather tell you what WiseNest doesn't model than have you discover it at the wrong moment. Trust is built on honesty — especially with retirement money.
What we model well
- Federal income tax with actual IRS brackets
- Social Security optimization for couples
- Real-Life Social Security: dependent children benefits, investment returns on early claim, solvency scenarios.
- Medicare IRMAA surcharges solved inside the withdrawal math, with the 2-year income look-back — a Roth conversion that would cross an IRMAA cliff is funded correctly, not under-budgeted
- RMDs with the IRS Uniform Lifetime Table — computed per spouse, each on their own Required Beginning Date, so an age-gap couple is timed correctly
- Roth conversion optimization including state tax — the cost of a conversion in California looks very different than in Texas, and the engine knows
- Monte Carlo with sequence-of-returns risk
- Life insurance gap from actual survivor shortfall
- Estate tax at federal and state level
- Downside severity (CVaR) and time-to-depletion — not just a pass/fail success rate
- Your risk band reflects your actual asset allocation — a cautious 40/60 plan shows less volatility than an aggressive 90/10, because the math reads your real mix
- Longevity on your terms — you choose the age to plan through, and your plan only counts as a success if the money lasts all the way to it. No comfortable average death age papering over the risk: the real danger is hitting $0 on the date you planned to, and that's exactly what we test
- Inflation as a volatile, return-correlated process — a 1970s-style shock (high inflation while markets fall) is in the model, not assumed away
- Correlated crashes — stocks, real estate, and foreign markets fall together in a downturn, the way 2008 actually felt, not politely one at a time
- Tax-smart withdrawal order — in the low-income gap years before RMDs, the engine fills the low brackets from pre-tax accounts before spending Roth, leaving tax-free growth untouched
- Your household readiness reflects each person's own plan and the accounts you actually entered — not a generic profile. The shared income and expenses you record show up in your family's totals view.
- Your whole household as one reconciled ledger — every dollar owned once, shared on purpose, and counted a single time.
Where we simplify
- Complex trusts (ILITs, GRATs, SLATs) — not modeled
- AMT and payroll taxes — not included
- Pension survivor benefits — simplified reduction, not full actuarial tables
- Healthcare: aggregate cost modeling, not your specific plan's premium data
- Social Security PIA: based on your estimate, not your SSA statement
- Market returns: historical averages with volatility — not guaranteed
Not financial advice. WiseNest is a planning tool, not an RIA. Talk to a fiduciary financial advisor before making major decisions — preferably one who uses WiseNest so they already have your numbers.
2,850+ automated tests.
Every single one runs before every deploy.
When you see a number in WiseNest, it has been checked by these automated tests — tax brackets, RMD tables, Monte Carlo reproducibility, IRMAA tiers, survivor benefit logic, and more. Every figure is auditable and explainable, with zero hidden assumptions.
Live demos — no login, no credit card
See the math in action — try any tier live
Enough math. Let's build your actual plan.
Seven days free. No credit card. Every calculation above — Monte Carlo, Real-Life SS Optimizer, Survivor Mode, tax intelligence — applied to your real numbers. Pick any tier and try it now.
Live demos — no login, no credit card
Have a financial advisor? Invite them to WiseNest Connect — your advisor joins, you get 3 months free →